Measuring Script Run Time
Append /start to a ping URL and use it to signal when a job starts.
After receiving a start signal, Healthchecks.io will show the check as "Started."
It will store the "start" events and display the job execution times. taliox.io - healthchecks
calculates the job execution times as the time gaps between adjacent "start" and
"success" events.
Note: if appending /start to the ping URL on the client side is not feasible, you can
alternatively configure taliox.io - healthchecks to classify HTTP pings as start, success, or failure
signals by looking for specific keywords in the HTTP request body.
Alerting Logic
taliox.io - healthchecks applies an additional alerting rule for jobs that use the /start signal.
If a job sends a "start" signal but does not send a "success" signal within its configured grace time, taliox.io - healthchecks will assume the job has failed. It will mark the job as "down" and send out alerts.
Usage Example
Below is a code example in Python:
import requests
URL = "https://hc.tlx.li/ping/your-uuid-here"


# "/start" kicks off a timer: if the job takes longer than
# the configured grace time, taliox.io - healthchecks will mark it as "down"
try:
    requests.get(URL + "/start", timeout=5)
except requests.exceptions.RequestException:
    # If the network request fails for any reason, we don't want
    # it to prevent the main job from running
    pass


# TODO: run the job here
fib = lambda n: n if n < 2 else fib(n - 1) + fib(n - 2)
print("F(42) = %d" % fib(42))

# Signal success:
requests.get(URL)
Viewing Measured Run Times
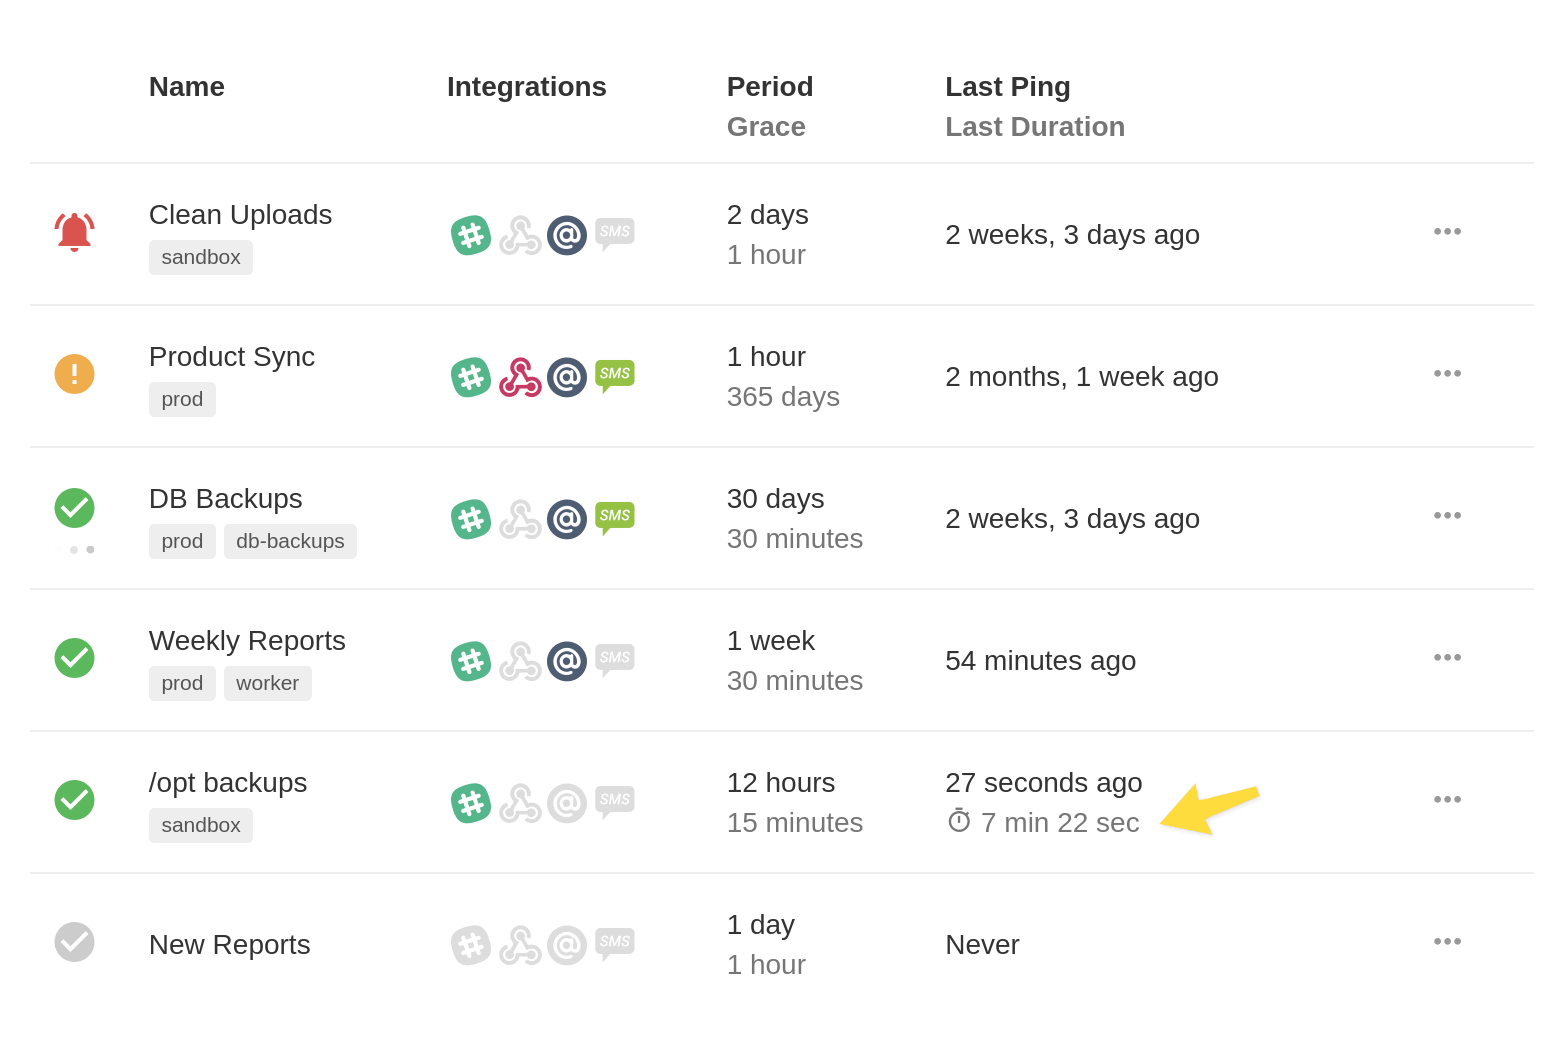
When taliox.io - healthchecks receives a "start" signal followed by a regular ping or a "fail" signal, and the two events are less than 72 hours apart, you will see the duration displayed in the list of checks. If the two events are more than 72 hours apart, they are assumed to be unrelated, and the duration is not displayed.

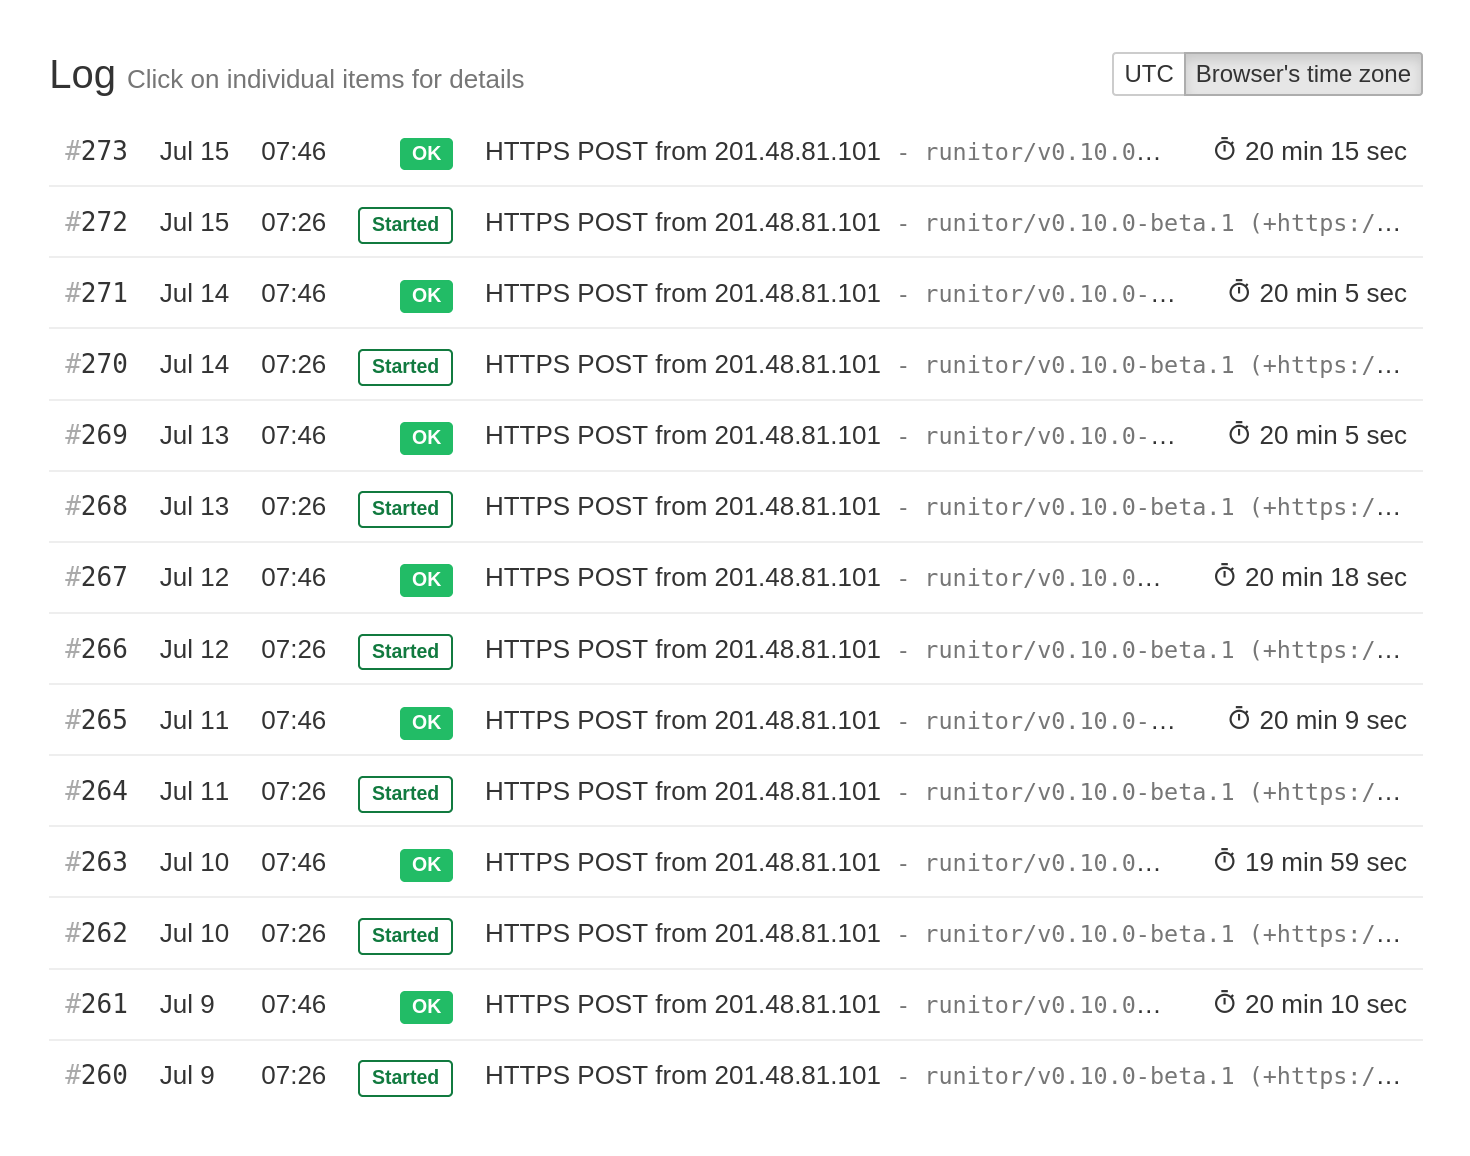
You can also see the durations of the previous runs when viewing an individual check:

Specifying Run IDs
When several instances of the same job can run concurrently, the calculated run times
can come out wrong, as taliox.io - healthchecks cannot reliably determine which success event
corresponds to which start event. To work around this problem, the client can
optionally specify a run ID in the rid query parameter of any ping URL. When a
success event specifies the rid parameter, taliox.io - healthchecks will look for a
start event with a matching rid value when calculating the execution time.
The run IDs must be in a specific format: they must be UUID values in the canonical
textual representation (example: 728b3763-ea80-4113-9fc0-f49b3adf226a, note no
curly braces). The letters in the UUID are allowed to be either in the lower or
upper case.
The client is free to pick run ID values randomly or use a deterministic process to generate them. The only thing that matters is that the start and the success pings of a single job execution use the same run ID value.
Below is an example shell script that generates the run ID using uuidgen and
makes HTTP requests using curl:
#!/bin/sh

RID=`uuidgen`

# send a start ping, specify rid parameter:
curl -fsS -m 10 --retry 5 https://hc.tlx.li/ping/your-uuid-here/start?rid=$RID

# ... FIXME: run the job here ...

# send the success ping, use the same rid parameter:
curl -fsS -m 10 --retry 5 https://hc.tlx.li/ping/your-uuid-here?rid=$RID
If the client specifies run IDs, taliox.io - healthchecks will display them in the "Events" section in a shortened form:

Also, note how the execution times are available for both "success" events. If the run IDs were not used in this example, the event #4 would not show an execution time since it is not preceded by a "start" event.
Alerting Logic When Using Run IDs
If a job sends a "start" signal but does not send a "success" signal within its configured grace time, taliox.io - healthchecks will assume the job has failed and notify you. However, when using Run IDs, there is an important caveat: taliox.io - healthchecks will not monitor the execution times of all concurrent job runs. It will only monitor the execution time of the most recently started run.
To illustrate, let's assume the grace time of 1 minute and look at the above example again. The event #4 ran for 6 minutes 39 seconds and so overshot the time budget of 1 minute. But taliox.io - healthchecks generated no alerts because the most recently started run completed within the time limit (it took 37 seconds, which is less than 1 minute).